- Background to the need to understand fracture
At ambient and low temperatures, materials fracture when stressed beyond some critical level. During the 19th century at the time of Rankine (1820 – 1872) and Tresca (1814 – 1885) this level of stress was defined as the “fracture strength” which would equate to the tensile strength for a uniaxial test specimen of a brittle material
The fracture strength was initially considered to be a material property. However, subsequent experience found that the fracture strength of many brittle materials was:
- Poorly reproducible under apparently identical testing conditions
- The fracture strength was strain rate, size and environmentally dependent.
The inadequacy of the fracture strength approach to the prediction of component failure was partly due to the empirical nature of this criteria and the difficulty to apply the criteria in a meaningful way at the design stage.
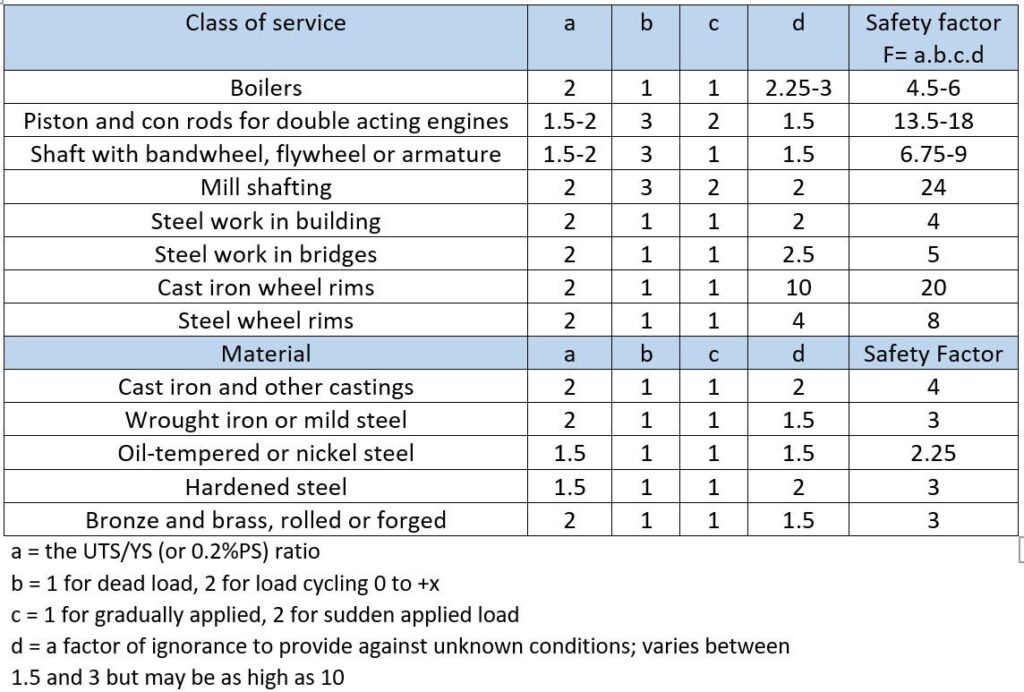
The design of safe parts required the application of factors of safety depending upon prior experience of the components as shown in the Table below. The need to use high safety factors was an impediment to cost effective efficient design.
The lack of success of the fracture strength criteria, in many engineering applications led to a serious reconsideration of the conditions to allow the prediction of material rupture/failure. This became an essential requirement with the development of nuclear power, space exploration and military applications
After a slow start, a new approach, referred to as “fracture mechanics” gained momentum, during the latter half of the 20th century and resulted in the creation of methods to predict failure of cracked parts and to allow the design of “safe” structures and engineering components.
Initial concept of stress concentration by CE Inglis and beyond
C E Inglis (1913), a naval architect, was one of the first to demonstrate the importance of stress concentration associated with cracks and imperfections that could increase the nominal stress applied to a part to a larger “local stress” at a notch or imperfection. This led to the realisation of the importance of shape and geometry of a part and that there could be significant amplification of stress at local imperfections or tight radii or notch. Based on the equations developed by Inglis there was concern regarding the possibility of an infinite stress associated with a fine crack! This fact caused much debate because stresses can never be infinite, and will be limited by a material’s yield or failure strength. Unfortunately, the criticism led to doubt over the mathematical approach used by Inglis. He pointed out that the possibility of infinite stress was related to the linear elastic assumptions of the mathematical approach and not to a real material response. In the discussion that followed the presentation of his paper, Inglis was also criticised because his mathematical approach could not predict a crack path. He made an apt reply calling the criticism “unreasonable” and made the observation “To settle this point, a knowledge of the stress in a body beyond its elastic limit is required, and this takes us into a region at present almost entirely unexplored”
It was the Griffiths equation (1920) that initiated the main break through to the understanding of the fracture process. A A Griffiths avoided the controversial problem of infinite stress associated with fine cracks that the C E Inglis equation predicted, by the use of an energy solution and calculated the strain energy released due to the new “free surface” created after a crack had propagated.
Using the energy approach A A Griffiths developed an equation that became famous since it demonstrated the salient features of the fracture process. However, at that time many engineers were uncomfortable since it did not conform to the stress and strain approach that they had been taught and were comfortable with.
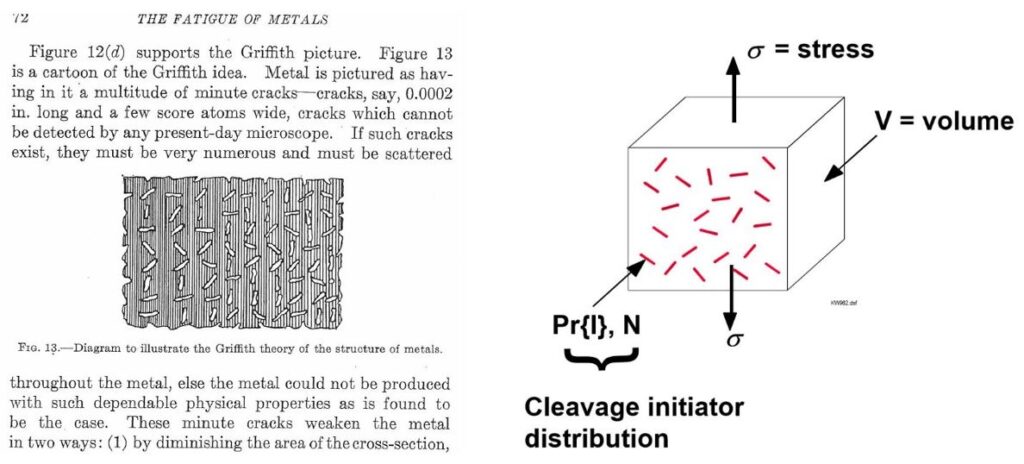
The basic approach was that the strain energy within the part provided the energy to create the new surface formed by the fracture process. The figure below on the LHS shows an extract from a 1920s’ book showing a cartoon of Griffiths theory.
It is ironic that following the work of Professor Kim Wallin we end with a similar graphic image with the concept of “Cleavage initiator distribution” nearly 100 years later, in 2005 (RHS)
Understanding the important terms and equations
Equation 1 The famous Griffiths equation This relationship provided the important “key” to solve the scatter with “fracture strength” (σc) and the assumption that “fracture strength” (σc) was a material property since this equation established that the fracture strength was inversely proportional to the square root of the crack size (a).
Equation 2 The Griffiths equation modified by Orowan 1947 Equation 1 was based on the assumption of brittle fracture without plastic deformation. Orowan (1950) recognized that, for metals and polymers, the fracture energy consumed in plastic deformation is much greater than the surface energy. Orowan suggested that, at any instance before reaching the critical stress, Equation 1 can be modified as shown in Equation 2, where γP is plastic deformation energy
Equation 3 A further modification by Irwin 1950. In the 1950s, Irwin chose to incorporate the energy sources into a single term, G, as shown in Equation 3, G, the elastic energy release rate, measures the change of elastic energy per change of crack length. It reaches a critical value, Gc, known as critical energy release rate, when fracture occurs. Gc is a material property and can be evaluated both analytically or experimentally using standard test specimen
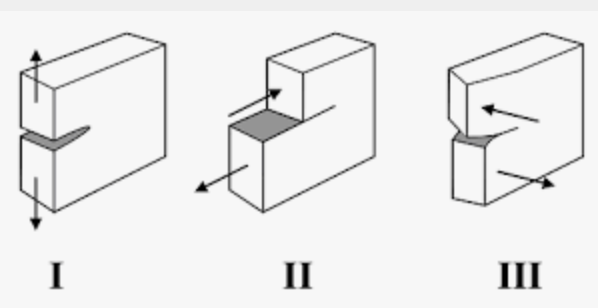
Equation 4 The emergence of stress intensity factor and critical stress intensity factor (fracture toughness) by Irwin 1957 introduced conventional stress and strain based methods. Another widely used parameter in fracture mechanics is the critical stress intensity factor, Kc, which is also called fracture toughness. There are three basic modes of crack propagation. Mode I is called opening mode (or tensile mode), mode II is called sliding mode (or in-plane shearing mode) and mode III is called tearing mode (or out-of-plane shearing mode). Mode I fracture is the most frequently encountered in engineering application.
The stress intensity factor represents the amplitude of the crack tip stress singularity and is related to the applied stress, the crack length and crack geometry. It can be expressed in a general form, as shown in Equation 4 where f(a/W) is geometric factor and is a function of crack length, a, and object width, W.
Equation 5 Different materials may sustain different critical stresses, σc, and a critical value of K for each of them exists. This critical stress intensity factor is also called fracture toughness and can be expressed as shown in Equation 5,
Equation 6 Kc and Gc are the two most used parameters that quantify how tough a material is before fracture. In fact, they are related through (Irwin, 1957) Equation 2.6, where E’ = E for plane stress and E’ = E/(1-ν2 ) for plane strain. A variety of testing configurations and standards has been developed to determine Kc and Gc for all kinds of materials (Anderson, 1995; ASTM E399; ASTM C1421; ASTM E1820).
4. How is Fracture Toughness Measured?
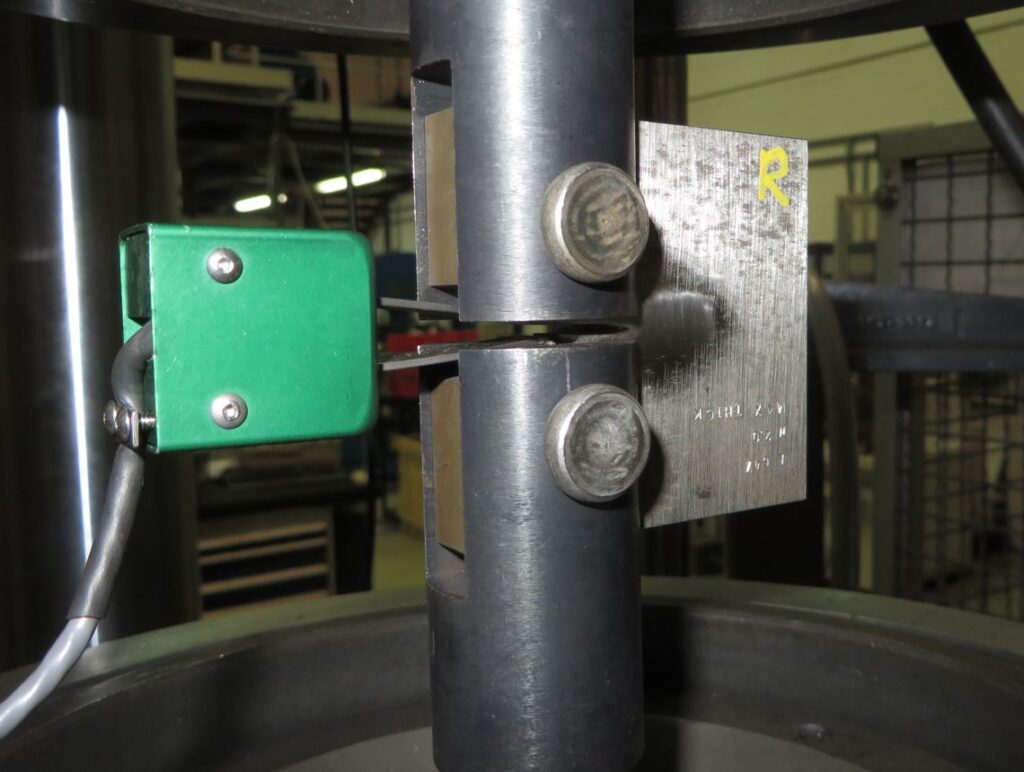
The American Society for Testing and Materials (ASTM) British Standards have developed fracture toughness testing standards based on K. J, and CTOD over many years. The main specification for the measurement of fracture toughness are the ASTM 1820 and BS 7448.
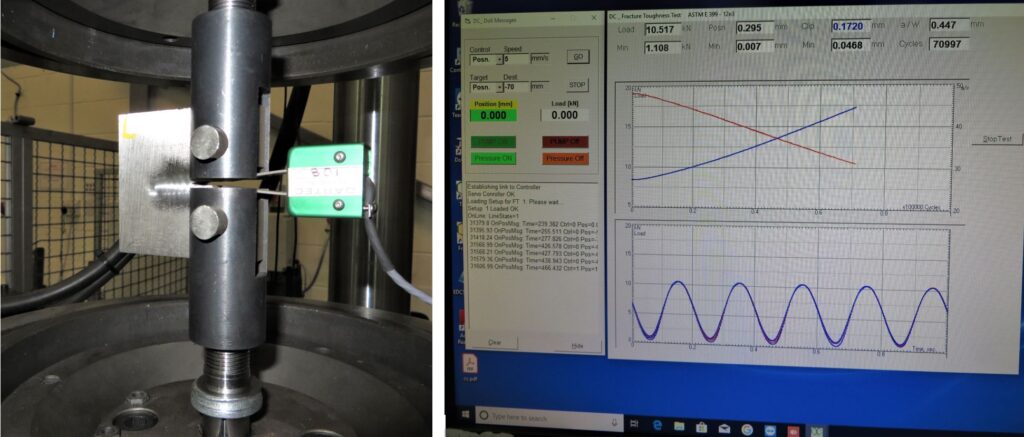
The determination of fracture toughness is software controlled both for the crack initiation and the final loading to complete the test.
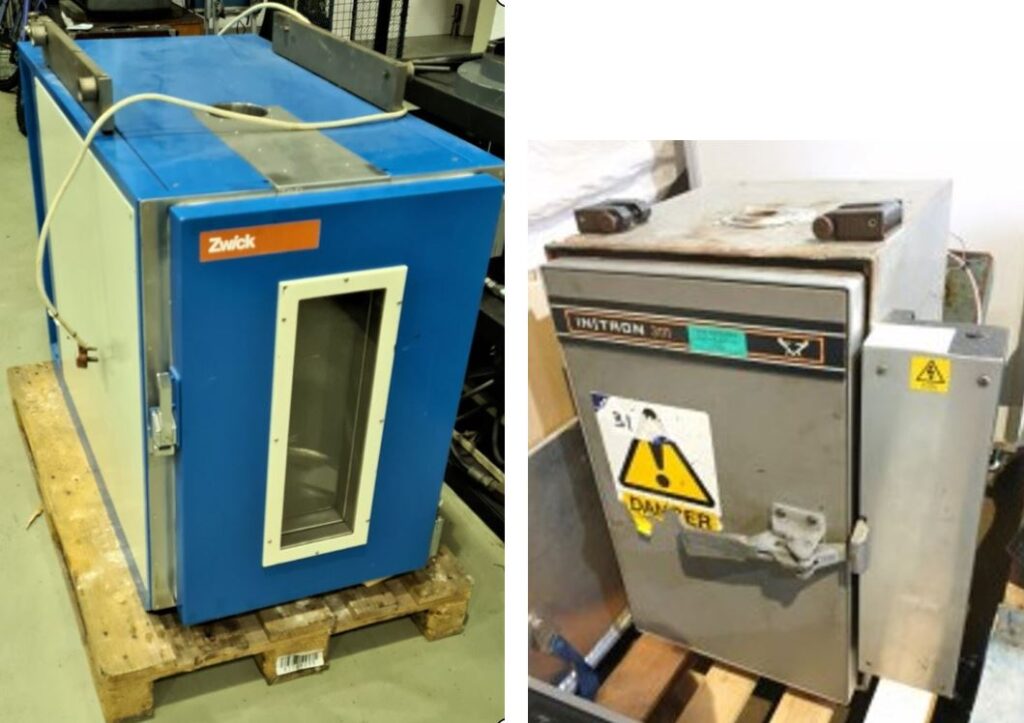
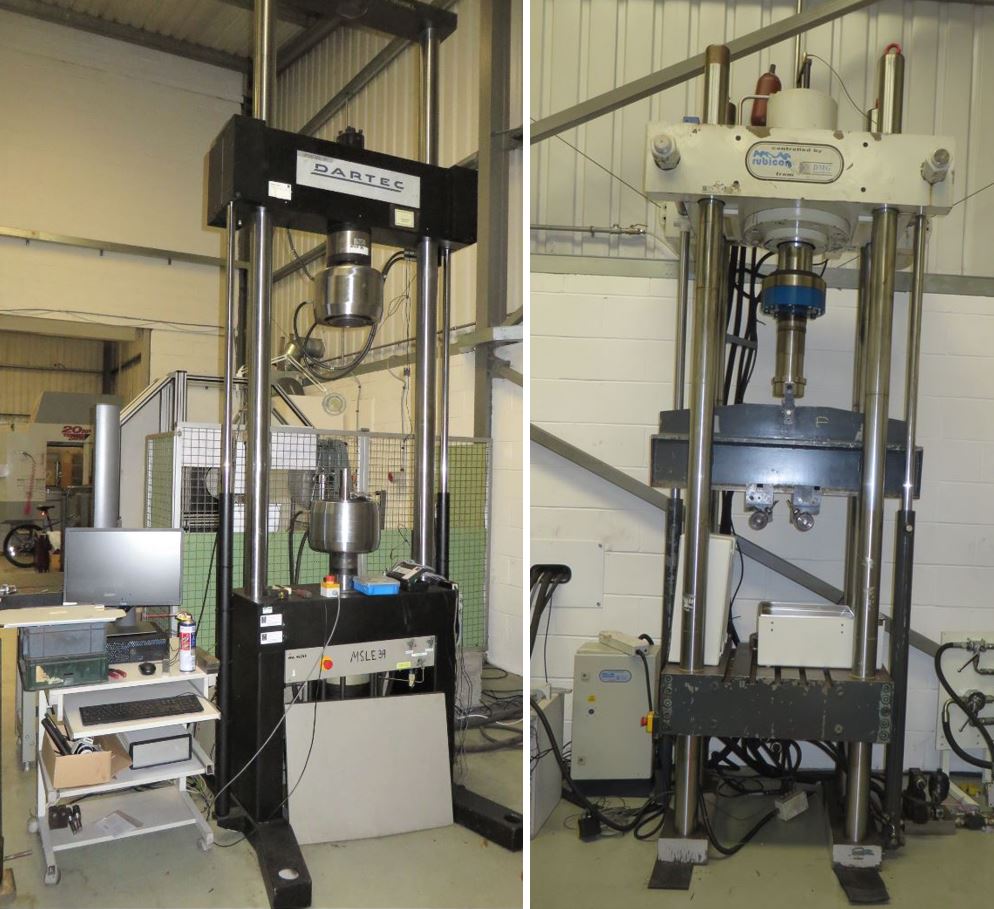
MSL have three load frames for fatigue and fracture toughness
A 250kN DMG Control Rubicon
A 500kN Dartec Upgraded with a Doli controller and Dirlik Controls Fracture Toughness software
A 1000kN DMG Control Rubicon.
Testing Using Dirlik Controls Fracture Toughness Software
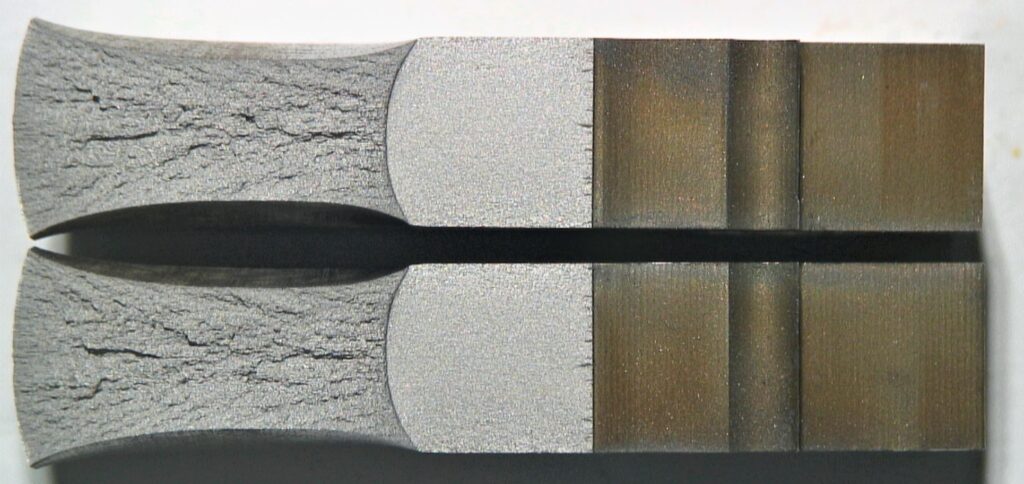
The final part of the test is to examine and to measure the fracture surface to establish that a valid test has been carried out. The dimensions are a required input into the Fracture Toughness software.
